Dear Aspirants,
We are providing the most important Data Interpretation Questions for SBI PO 2019, SBI Clerk 2019 and all other competitive bank and insurance exams. These questions have very high chances to be asked in SBI PO 2019, SBI Clerk 2019.
Get the Best Test Series for SBI PO 2019 at the most affordable price (Based on Real Exam Pattern) – Click Here
Download the Best GK Gaming App for Current Affairs and GK (Bank+SSC)– Click here
Directions (1-5): Study the following information carefully and answer the given questions:
The given bar graph shows the number of students in three different departments in four different colleges.

1. What is the ratio of the total number of students in EEE departments in all the colleges together to the total number of students in CSE departments in all the colleges together?
2. What is the difference between the average number of students in college D and A in all the departments together?
3. The number of EEE students in C is approximately what percent of the number of ECE students in B?
4. The total number of students in C in all the departments together is approximately what percent of the total number of students in B in all the departments together?
5. What is the average number of ECE students in all the colleges together?
Directions (6-10): Study the following information carefully and answer the given questions:
The pie chart shows the number of students like five different sports.

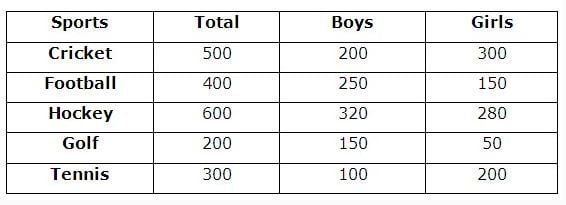
The given table shows the number of boys to girls like five different sports.

6. What is total number of boys like all the sports together?
7. The number of girls likeFootball is approximately what percent of the number of boys like Cricket?
8. What is the ratio of the number of girls like Golf to the number of girls like Tennis?
9. The number of boys like Hockey is approximately what percent of the number of students like Hockey?
10. What is the difference between the total number of boys and girls like all the sports together?
Check your Answers below:
Directions (1-5): Study the following information carefully and answer the given questions:
The given bar graph shows the number of students in three different departments in four different colleges.

1. Question
What is the ratio of the total number of students in EEE departments in all the colleges together to the total number of students in CSE departments in all the colleges together?
Ans:1
CSE students=200 + 100 + 250 + 300=850
EEE students=150 + 200 + 100 + 200=650
Required ratio=650:850
=13:172. Question
Directions (1-5): Study the following information carefully and answer the given questions:
The given bar graph shows the number of students in three different departments in four different colleges.
What is the difference between the average number of students in college D and A in all the departments together?Ans:2
Difference=(300 + 200 + 100)/3 – (200 + 150 + 100)/3
=503. Question
Directions (1-5): Study the following information carefully and answer the given questions:
The given bar graph shows the number of students in three different departments in four different colleges.
The number of EEE students in C is approximately what percent of the number of ECE students in B?Ans:5
Required percentage=100/250 * 100=40%4. Question
Directions (1-5): Study the following information carefully and answer the given questions:
The given bar graph shows the number of students in three different departments in four different colleges.
The total number of students in C in all the departments together is approximately what percent of the total number of students in B in all the departments together?Ans:3
Required percentage= [(250 + 100 + 150)/(100 + 200 + 250)] * 100
=91%5. Question
Directions (1-5): Study the following information carefully and answer the given questions:
The given bar graph shows the number of students in three different departments in four different colleges.
What is the average number of ECE students in all the colleges together?Ans:4
Required average= (100 + 250 + 150 + 100)/4=150Directions (6-10): Study the following information carefully and answer the given questions:
The pie chart shows the number of students like five different sports.

6. Question
The given table shows the number of boys to girls like five different sports.

What is total number of boys like all the sports together?Ans:3

Total number of boys=200 + 250 + 320 + 150 + 100=10207. Question
Directions (6-10): Study the following information carefully and answer the given questions:
The pie chart shows the number of students like five different sports.
The given table shows the number of boys to girls like five different sports.
The number of girls likeFootball is approximately what percent of the number of boys like Cricket?Ans:2
Required percentage=150/200 * 100=75%8. Question
Directions (6-10): Study the following information carefully and answer the given questions:
The pie chart shows the number of students like five different sports.
The given table shows the number of boys to girls like five different sports.
What is the ratio of the number of girls like Golf to the number of girls like Tennis?Ans:2
Required ratio=50:200
=1:49. Question
Directions (6-10): Study the following information carefully and answer the given questions:
The pie chart shows the number of students like five different sports.
The given table shows the number of boys to girls like five different sports.
The number of boys like Hockey is approximately what percent of the number of students like Hockey?Ans:4
Required percentage=320/600 * 100=53%10. Question
Directions (6-10): Study the following information carefully and answer the given questions:
The pie chart shows the number of students like five different sports.
The given table shows the number of boys to girls like five different sports.
What is the difference between the total number of boys and girls like all the sports together?Ans:3
Total number of boys=200 + 250 + 320 + 150 + 100=1020
Total number of girls=300 + 150 + 280 + 50 + 200=980
Difference=1020 – 980=40