Dear Aspirants,
We are providing the most important Data Interpretation Questions for SBI PO 2019, SBI Clerk 2019 and all other competitive bank and insurance exams. These questions have very high chances to be asked in SBI PO 2019, SBI Clerk 2019.
Get the Best Test Series for SBI PO 2019 at the most affordable price (Based on Real Exam Pattern) – Click Here
Download the Best GK Gaming App for Current Affairs and GK (Bank+SSC)– Click here
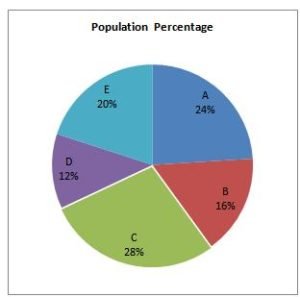
Directions:(1-5) Study the following graph carefully and answer the given questions
The Pie chart shows the percentage of population in five different villages. Total population of all the villages are 26800.
1. Total population of village A and B is approximately what percentage more/less than the total population of village C?
2. If the ratio of the number of male and female in village B is 5:3 then approximately what percentage of male in village B is more/less than the total population of village D?
3. What is the ratio of population of village E and population of village B?
4. If 15% population of village E has electricity connection and 50% population of village C has electricity connection then what is the total number of people in village E and village C who does not have electricity connection?
5. Population of village A and village D have how much more/less population than village B and village E?
Directions (6-10): What value should come in the place of question mark in the given questions?
Number of students from three different schools who qualified in an exam in four different years

6. What is the difference between the annual average students of qualified from School A and annual average students of qualified from School C in the given year?
7. What is the difference between the number of students qualified from School C in 2005 and the number of students qualified from School B in 2007?
8. The total number of students qualified from School B in 2008 is approximately what percent more than total number of students qualified from School A in 2006?
9. What is the approximate percentage decrease in the number of students qualified from School C in 2008 from 2007?
10. Find the average number of students qualified from School B in all the four years together?
Check your Answers below:
Directions:(1-5) Study the following graph carefully and answer the given questions
The Pie chart shows the percentage of population in five different villages. Total population of all the villages are 26800.

1. Question
Total population of village A and B is approximately what percentage more/less than the total population of village C?Ans: 2
Population of village A= (26800 * 24)/100 = 6432
Population of village B= (26800* 16)/100 = 4288
Population of village C= (26800*28)/100 = 7504
Total Population of village A and B = 6432 + 4288 = 10720
Require percentage = [(10720 – 7504)/7504] * 100
= (3216/7504) * 100 = 42.85% ≈ 43%2. Question
Directions:(1-5) Study the following graph carefully and answer the given questions
The Pie chart shows the percentage of population in five different villages. Total population of all the villages are 26800.
If the ratio of the number of male and female in village B is 5:3 then approximately what percentage of male in village B is more/less than the total population of village D?
Ans: 1
Population of village B= (26800* 16)/100 = 4288
Population of village D= (26800* 12)/100 = 3216
Male in village B = (5/8) * 4288 = 2680
Require percentage (less) = [(3216 – 2680)/3216] * 100
= (536/3216) * 100 = 16.67% ≈ 17%3. Question
Directions:(1-5) Study the following graph carefully and answer the given questions
The Pie chart shows the percentage of population in five different villages. Total population of all the villages are 26800.
What is the ratio of population of village E and population of village B?Ans: 3
Population of village B= (26800* 16)/100 = 4288
Population of village E= (26800* 20)/100 = 5360
Require ratio = 5360: 4288 = 335: 2684. Question
Directions:(1-5) Study the following graph carefully and answer the given questions
The Pie chart shows the percentage of population in five different villages. Total population of all the villages are 26800.
If 15% population of village E has electricity connection and 50% population of village C has electricity connection then what is the total number of people in village E and village C who does not have electricity connection?Ans: 3
Population of village E= (26800* 20)/100 = 5360
Population of village C= (26800*28)/100 = 7504
Total number of people in village E who does not have electricity connection,
= (85 * 5360)/100
= 4556
Total number of people in village C who does not have electricity connection,
= (50 * 7504)/100
= 3752
Total number of people in village E and village C who does not have electricity connection,
= 4556 + 3752 = 83085. Question
Directions:(1-5) Study the following graph carefully and answer the given questions
The Pie chart shows the percentage of population in five different villages. Total population of all the villages are 26800.
Population of village A and village D have how much more/less population than village B and village E?Ans: 4
Required difference = [(24+12)-(20+16)]*26800/100
= 0/100*26800
Difference = 0Directions (6-10): What value should come in the place of question mark in the given questions?
Number of students from three different schools who qualified in an exam in four different years

6. Question
What is the difference between the annual average students of qualified from School A and annual average students of qualified from School C in the given year?
Ans: 1
Average students of qualified from school A in three years
=(8500+8000+9500+6500)/4
=8125
Average students of qualified from school C in three years
=(9000+8500+7500+5000)/4
=7500
Difference=8125-7500
=6257. Question
Directions (6-10): What value should come in the place of question mark in the given questions?
Number of students from three different schools who qualified in an exam in four different years
What is the difference between the number of students qualified from School C in 2005 and the number of students qualified from School B in 2007?Ans: 3
Number of students qualified from School C in 2005=9000
Number of students qualified from School B in 2007=8000
Difference=9000-8000
=10008. Question
Directions (6-10): What value should come in the place of question mark in the given questions?
Number of students from three different schools who qualified in an exam in four different years
The total number of students qualified from School B in 2008 is approximately what percent more than total number of students qualified from School A in 2006?Ans: 3
The total number of students qualified from School B in 2008=9000
The total number of students qualified from School A in 2006=8000
Percentage=(9000-8000)*100/8000
=12.5%9. Question
Directions (6-10): What value should come in the place of question mark in the given questions?
Number of students from three different schools who qualified in an exam in four different years
What is the approximate percentage decrease in the number of students qualified from School C in 2008 from 2007?Ans: 1
The number of students qualified from School C in 2007=7500
The number of students qualified from School C in 2008=5000
Percentage=100*(7500-5000)/7500
=33.333%10. Question
Directions (6-10): What value should come in the place of question mark in the given questions?
Number of students from three different schools who qualified in an exam in four different years
Find the average number of students qualified from School B in all the four years together?Ans: 1
The number of students qualified from School B in 2005=6000
The number of students qualified from School B in 2006=5500
The number of students qualified from School B in 2007=8000
The number of students qualified from School B in 2008=9000
Average=(6000+5500+8000+9000)/4
=7125